Understanding the Excel Interface
Δημοσιευμένα 2024-07-26 04:31:22
0
8χλμ.

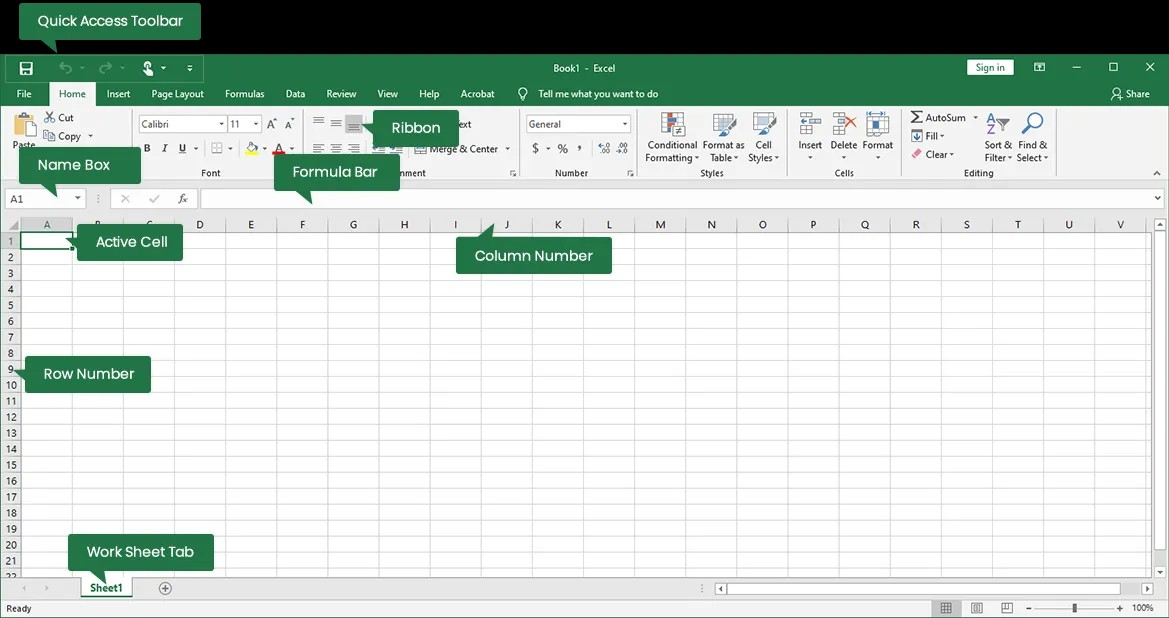
Excel's interface is designed to be user-friendly, but it can seem overwhelming at first. Let's break it down into its core components:
Basic Components
- Workbook: The main file containing one or more worksheets.
- Worksheet: A sheet within a workbook where you input and analyze data.
- Cell: The intersection of a row and column where data is entered.
- Row: A horizontal line of cells identified by numbers (1, 2, 3, etc.).
- Column: A vertical line of cells identified by letters (A, B, C, etc.).
Interface Elements
- Title Bar: Displays the workbook name and Excel application name.
- Quick Access Toolbar: Customizable toolbar for frequently used commands.
- Ribbon: Contains tabs (Home, Insert, Page Layout, etc.) with groups of commands.
- Name Box: Shows the address of the active cell.
- Formula Bar: Displays the contents of the active cell (data or formula).
- Worksheet Tabs: Allow you to switch between different worksheets.
- Scroll Bars: Used to navigate through the worksheet.
- Status Bar: Shows information about the worksheet, such as number of selected cells.
Key Areas of the Ribbon
- Home: Basic formatting, editing, and cell alignment.
- Insert: Add tables, charts, pictures, shapes, and more.
- Page Layout: Control page margins, orientation, themes, and scaling.
- Formulas: Insert functions, names, and perform calculations.
- Data: Sort, filter, analyze data, and create data connections.
- Review: Proofing, comments, protection, and changes tracking.
- View: Customize worksheet appearance, zoom, and display options.
Navigating and Using Excel
- Selecting Cells: Click on a cell to make it active. Drag to select a range of cells.
- Entering Data: Type data directly into the active cell or formula bar.
- Using Formulas: Start with an equal sign (=), then enter functions or cell references.
- Formatting: Apply fonts, colors, number formats, and cell styles.
- Creating Charts: Visualize data with various chart types.
- Sorting and Filtering: Organize data based on specific criteria.
Would you like to delve deeper into a specific area of the Excel interface or learn how to perform a particular task?
I can provide more detailed explanations, examples, and step-by-step instructions.
Here are some possible topics:
- Basic data entry and formatting
- Creating and using formulas
- Creating charts
- Data analysis tools
- Excel shortcuts
Αναζήτηση
Κατηγορίες
- Technology
- Εκπαίδευση
- Business
- Music
- Got talent
- Film
- Politics
- Food
- Παιχνίδια
- Gardening
- Health
- Κεντρική Σελίδα
- Literature
- Networking
- άλλο
- Party
- Religion
- Shopping
- Sports
- Theater
- Wellness
Διαβάζω περισσότερα
Reconstruction timeline
January 1863: Abraham Lincoln issues the Emancipation Proclamation, freeing enslaved...
Popular Linux Distributions
Linux distributions, or distros, come in various forms tailored to different user needs, ranging...
Learning Microsoft Excel can be beneficial for a variety of reasons
Data Organization: Excel allows users to store, organize, and manage large sets of data...


