

![HL – Rotation curves of galaxies [IB Physics HL]](https://i.ytimg.com/vi/vqGhG190Flk/maxresdefault.jpg)


Acid base indicators and pH titration curves

Physical chemistry for A level students especially for those for UACE exams in Uganda
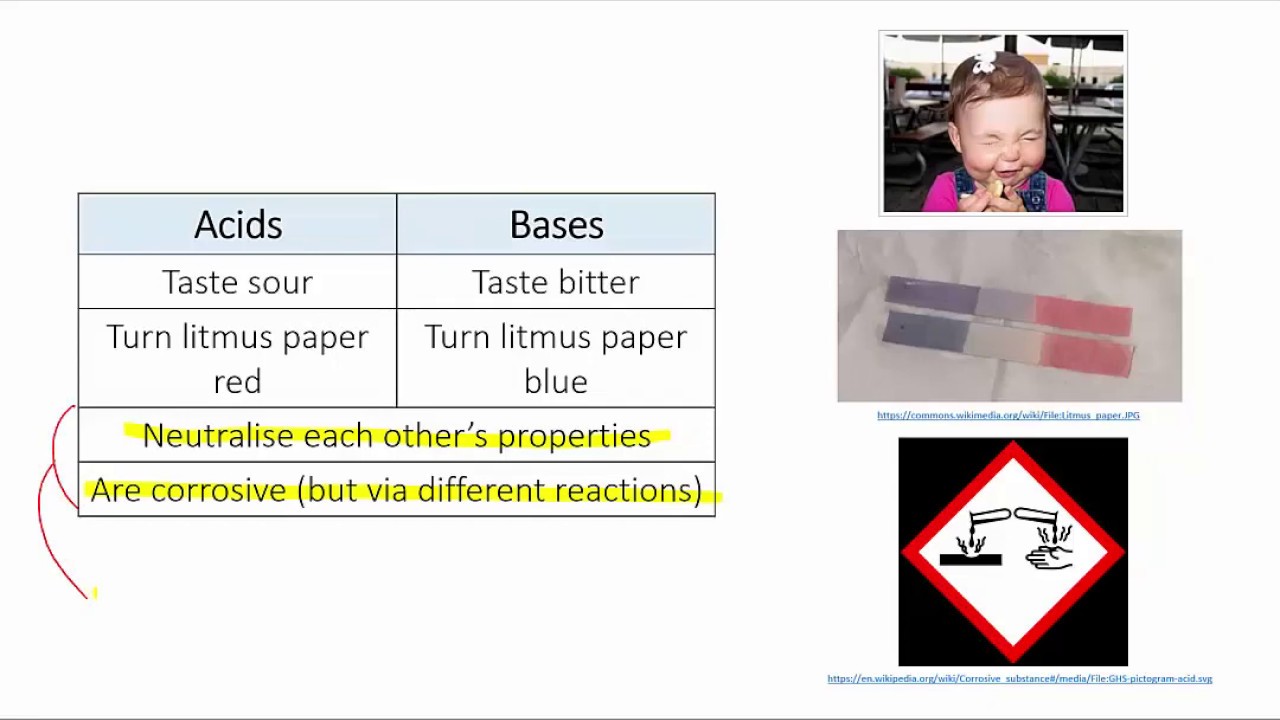
Acid-base indicators are substances that undergo a color change in response to changes in the pH of a solution. They are often used in chemical experiments and titration procedures to determine the endpoint of an acid-base reaction. Different indicators have different pH transition ranges and colors, allowing for the identification of the pH range during a titration.
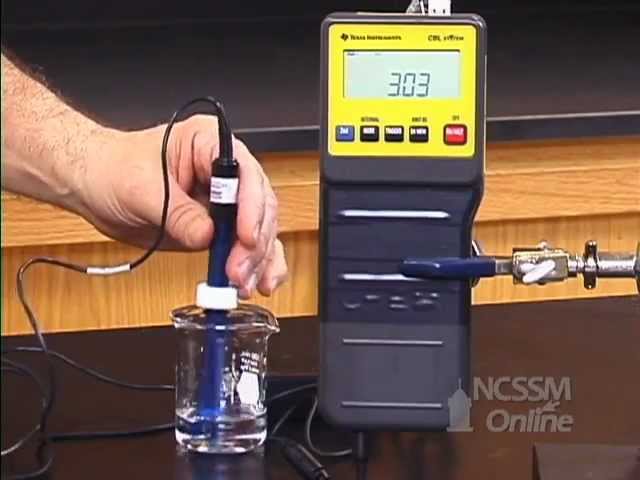
pH titration curves, on the other hand, are graphical representations of the pH of a solution as a function of the volume of a titrant added during a titration. In an acid-base titration, a solution of known concentration (titrant) is slowly added to a solution of unknown concentration (analyte) until the reaction between the two is complete. The pH titration curve plots the pH of the solution being titrated against the volume of titrant added.
The shape of a pH titration curve depends on the nature of the acid and base involved in the reaction, as well as their relative concentrations. The curve typically starts at a low pH when only the acid is present, rises gradually as the titrant is added, and eventually undergoes a rapid change near the equivalence point, where stoichiometrically equivalent amounts of acid and base have reacted. After the equivalence point, the curve levels off and remains at a high pH when only excess base is present.
The behavior of the pH titration curve depends on the strength of the acid and base being titrated. For strong acids and strong bases, the curve is relatively steep around the equivalence point, resulting in a sharp endpoint and a well-defined titration. For weak acids and weak bases, the curve will be smoother and have a more gradual change around the equivalence point, making it more difficult to determine the exact endpoint of the titration.
By using acid-base indicators in titrations, the color change of the indicator can be used to visually identify the endpoint of the titration. The indicator is chosen based on its pH transition range, which is the pH range over which the indicator changes color. For example, phenolphthalein is often used as an indicator in acid-base titrations, as it changes from colorless to pink in a pH range of 8.2 to 10.0. By observing the color change of the indicator, the endpoint of the titration can be determined, indicating that the reaction is complete.
In summary, acid-base indicators are substances that change color in response to changes in pH, allowing for the observation of endpoint during titrations. pH titration curves, on the other hand, are graphical representations of the pH of a solution as a function of the volume of titrant added during a titration. They depict the behavior of pH during a titration and can be used to determine the equivalence point and the strength of the acid and base involved.
