


pH curve for titration of a weak base with a strong acid

A titration pH curve is a graphical representation of how the pH of a solution changes as a titration progresses. It typically exhibits several distinct features that can provide valuable information about the reaction being studied. The main features of a titration pH curve are:
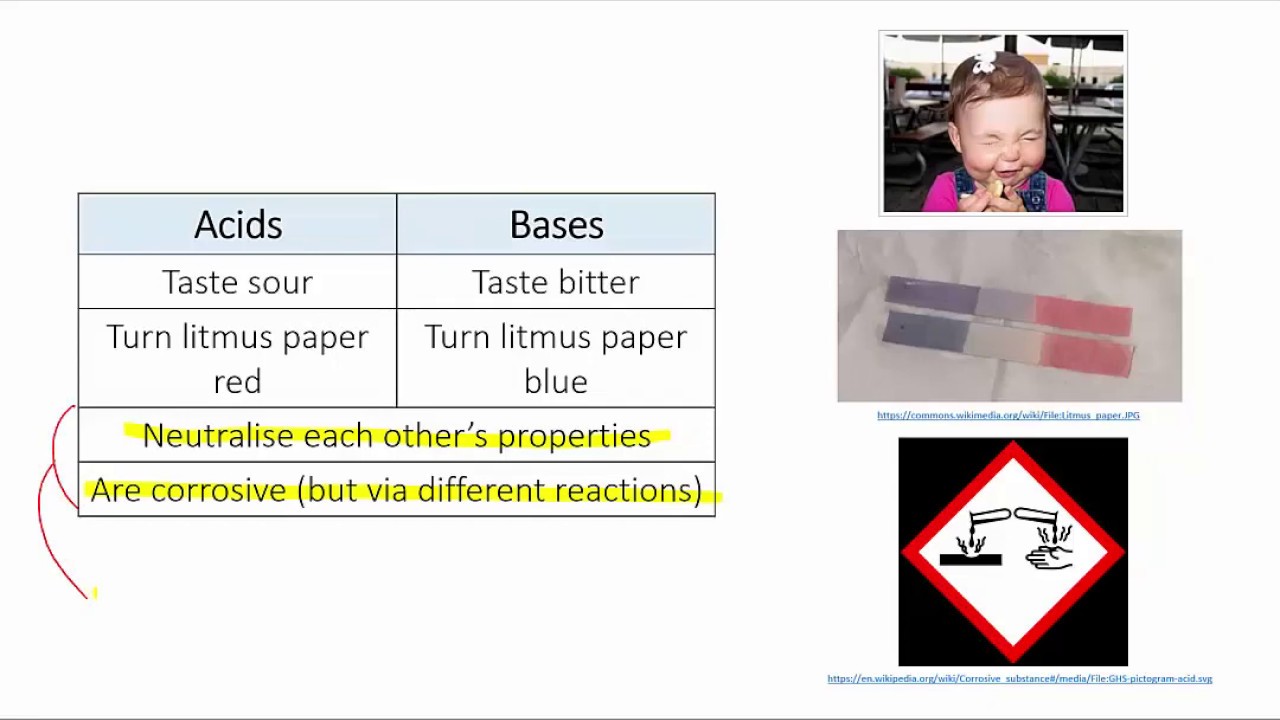
1. Initial pH: At the start of the titration, before any titrant has been added, the initial pH is determined by the solution being titrated. For example, if an acidic solution is being titrated against a basic titrant, the initial pH will be low (acidic).
2. Slow pH change: Initially, as the titrant is added slowly, the change in pH is relatively slow because the reaction between the titrant and analyte is not yet significant enough to alter the pH dramatically. This region is often referred to as the buffering region, as the solution's pH remains relatively stable.
3. Equivalence point: The equivalence point is the point at which the stoichiometrically equivalent amounts of acid and base have reacted. At this point, the pH undergoes a rapid change. For the reaction between a strong acid and a strong base, the equivalence point occurs at pH 7, indicating a neutral solution.
4. Midpoint of the buffering region: Before reaching the equivalence point, there is a point where the pH undergoes the steepest slope, known as the midpoint of the buffering region. This point corresponds to approximately halfway between the initial pH and the pH at the equivalence point. It is an important reference point as it helps determine the pH range over which the buffer works effectively.
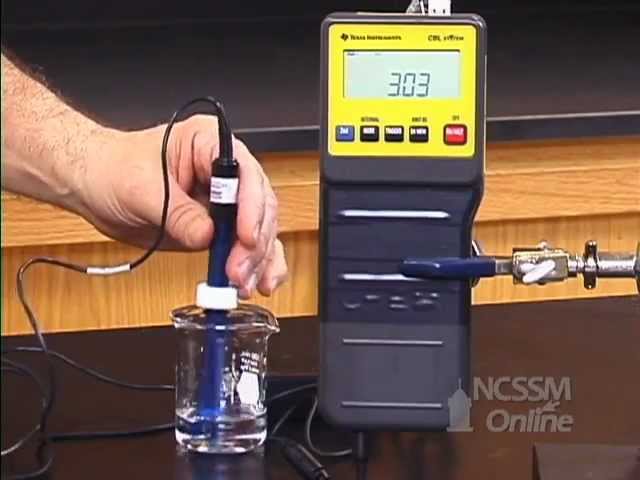
5. Endpoint: The endpoint is the point at which the indicator used in the titration changes color, indicating that the reaction is approaching completion. Ideally, the endpoint should coincide with the equivalence point, but in practice, slight differences may occur.
6. Post-equivalence region: After passing the equivalence point, the pH continues to change, but at a slower rate compared to the pre-equivalence region. In the case of titrating a strong acid with a strong base or vice versa, the pH in this region approaches the pH of the excess titrant. Thus, if a strong acid is being titrated with a strong base, the pH will increase above 7. The shape and steepness of this region depend on the nature and concentration of the titrant and analyte.
These features collectively provide insight into the behavior of the titration, helping determine the equivalence point, the stoichiometry of the reaction, the strength of the acid or base, and the buffering capacity of the solution. Analyzing the pH curve allows for the proper interpretation of the experimental data obtained during titration.
